Programmer’s Journal: Debugging a web app for iPad on Windows
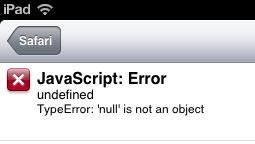
It’s never been easy to debug webpages on an iPad. Unlike Chrome and Firefox (and even IE these days), which have developer consoles chock-full of useful gadgets, Safari only has a console log…
and now even that’s gone! Now, you need a Mac to even see the console output.
While I think Macs are great computers, I hadn’t really planned on throwing out my three Windows machines and my development environment just to fix a web app (or, you know, spending a thousand dollars on another computer). Fortunately, you can get at least some of that functionality back by using this snippet:
<script type="text/javascript" src="https://getfirebug.com/firebug-lite.js">
 { overrideConsole: true,
 startOpened: true,
 enableTrace: true
 }
</script>
<script>
 window.onerror = function(msg, url, linenumber) {
 console.log('Error message: ' + msg + '\nURL: ' + url + '\nLine Number (useless on iPad): ' + linenumber);
 return true;
 };
</script>
This code will set up Firebug Lite on your machine, and also print error messages to the console. Unfortunately, line numbers don’t show up correctly on iOS 6, but it’s far better than nothing, and far cheaper than getting a new computer!
November 13, 2013 Wednesday at 3:21 am


